01 Summary
This application note demonstrates a reproducible process for the successful attachment and expansion of hUC-MSCs (human umbilical cord-derived mesenchymal stem cells) on microcarriers using the Lattice mini modular bioreactor system. Expanding these cells in Lattice significantly reduces media consumption compared to a traditional 2D process while achieving an equivalent yield and maintaining the MSC phenotype — therefore offering a cost-effective solution for therapeutic manufacturing.
02 Introduction & background
Human mesenchymal stem cells (hMSCs) are of significant interest in the fields of modern cell therapy and regenerative medicine, due to their immunomodulatory and regenerative properties. A number of both autologous and allogeneic therapies have already been approved worldwide utilising MSCs to treat a range of diseases such as graft-versus-host disease, cardiovascular diseases, liver diseases and inflammatory disorders (Zeiser et al., 2023). Furthermore, the efficacies of secretome and extracellular vesicles (EVs) produced by MSCs as cell-free treatments are an active and promising area of clinical research.
Despite their immense clinical promise, translating hMSC therapies from early-phase clinical trials to widespread commercialisation presents significant manufacturing challenges. Effective treatments often require hundreds of millions of cells per patient, meaning a single commercial lot can require up to 100 billion cells (Lembong et al., 2020). Cell-free products also demand scalable expansion. Unfortunately, extensive expansion results in high cumulative population doubling levels (PDLs), in turn triggering replicative senescence, morphological changes, and a loss of stemness and differentiation potential (Wagner et al., 2008). Consequently, manufacturing processes must achieve these yields within narrow, low-PDL windows to preserve cellular quality and therapeutic potency.
Traditional 2D planar culture systems, such as T-flasks and multi-layer cell factories, are inherently limited by surface area inefficiency. Labour-intensive 2D processes lack the scalability required to meet the demands of commercial biopharma manufacturing.
Transitioning to 3D suspension culture using microcarriers provides a highly effective method for scaling adherent cells like hUC-MSCs. By providing a surface-area-to-volume ratio that increases linearly with carrier concentration, microcarriers significantly increase the available growth area within a given bioreactor volume, maximising volumetric productivity whilst enabling automated, closed-system processing (Lembong et al., 2020).
Nevertheless, microcarrier process optimisation presents a new set of challenges. Impeller-driven agitation must maintain carriers in continuous suspension to prevent settling (Hewitt et al., 2011), yet localised high-shear zones can cause cell detachment, damage their membranes, and impair growth.
To overcome this, the Lattice mini bioreactor platform provides an optimal, low-shear environment suitable for the expansion of sensitive adherent cells on microcarriers. A uniform flow of both fluid and microcarriers is achieved through a controlled rocking motion, allowing for homogenous mass transfer of oxygen and nutrients whilst keeping carriers suspended at all times. The gas-permeable membrane of the Lattice bioreactor allows for sufficient supply of oxygen, eliminating potential cell damage and foaming caused by invasive sparging.
Each Lattice mini unit holds up to six individual vessels, delivering a modular scale-out platform through which production capacity can be increased without requiring scale-dependent re-optimisation. Physical isolation between vessels mitigates batch failure risks by confining potential contamination or operator error to a single vessel. For the production of autologous treatments, this vessel-level independence guarantees strict patient segregation and matches patient-specific yields, without wasting media on oversized vessel volumes.
Across three independent batches, this application note demonstrates the successful attachment and expansion of hUC-MSCs on microcarriers using the Lattice mini bioreactor platform — highlighting a scalable, cost-effective pathway to commercial-scale cell yields for cell therapy manufacturing.
03 Objective
The objective of this study is to evaluate the Lattice system for effective hUC-MSC attachment and expansion on microcarriers to meet therapeutic yield targets. Specifically, the aim is to achieve growth kinetics and maintenance of stemness and potency comparable to traditional 2D processes, whilst demonstrating the advantages of Lattice through significantly reduced media costs and simplified handling.
This study evaluates hUC-MSC expansion exclusively within 250 mL Lattice mini vessels, using standard T-flasks as the 2D benchmark control. Larger Lattice vessel scales, alternative bioreactor platforms, and downstream cell differentiation fall outside the scope of this note.
04 Materials & Methods
Bioreactor system
Cultivation was conducted in our proprietary modular bioreactor system, Lattice mini. Each Lattice vessel consists of a flexible, gas-permeable polymer membrane capable of operating at 210–250 mL working volume. Up to six individual vessels can be mounted in one Lattice mini unit. The motor attached to each unit provides automated agitation through a rocking motion, eliminating cell contact with internal mixing components common in traditional stirred-tank reactor systems. Fluid transfers were managed through aseptic ports on each individual vessel. Prior to cell cultivation, the reusable vessels were sterilised and integrity-tested.
Process parameters
- Incubator temperature: 37°C
- Incubator CO₂ set-point: 4.5–5%
- pH: maintained between 7.1–7.5 via passive diffusion of CO₂ and sodium bicarbonate in culture medium
- Oxygen saturation: maintained between 90–100% via passive diffusion of O₂
- Agitation: amplitude 8–12°, acceleration 5–12 deg/s², pause duration 1–2 s
- Feed strategy: fed-batch with 2% volumetric addition of feed on day three of culture
Attachment protocol
- Inoculation with total cells and primed microcarriers at a reduced working volume
- Total duration: 6 hours
- Agitation: 1 minute of rocking every hour
- Vessels topped up with medium to full working volume at the end of the attachment phase and continuous agitation initiated
Biological system
- Cells: xeno-free human umbilical cord-derived mesenchymal stem cells (RoosterBio®)
- Media: RoosterNourish™-MSC-XF expansion medium and RoosterReplenish™-MSC-XF feed
- Carriers: solid-core polystyrene carriers with surface area of 360 cm²/g and diameter 125–212 µm
- Carrier density: 14 g/L
- Cell seeding density: 21.2 × 10³ ± 1.8 × 10³ cells/mL
- Working volume at seed: 210–220 mL
- Expansion duration: five days
Three batches were run with culture health and performance monitored via offline analysis of samples drawn from representative vessel ports at defined timepoints. Cell counts were carried out on dissociated samples using a NucleoCounter® NC-250™ Automated Cell Analyzer. Offline tracking of glucose, lactate, ammonia (NH₄⁺), pH, pCO₂, and pO₂ was performed using a BioProfile® FLEX2 analyser. Live cell staining was carried out using calcein AM and images were captured using the EVOS™ M7000 Imaging System. Flow cytometry analysis of MSC markers was carried out using a SH800S Cell Sorter (SONY), and antibodies used were purchased from Miltenyi Biotec.
2D controls were cultured on T-flasks seeded at 3,000 cells/cm², 0.2 mL/cm² of expansion medium, with a three-day expansion period. Flasks did not receive any feeds.
Figure 1 shows the expansion process in Lattice mini. This was developed following the RoosterBio® recommended expansion protocol for fed-batch culture in 125 mL spinner flasks (RoosterBio, Inc, 2023).
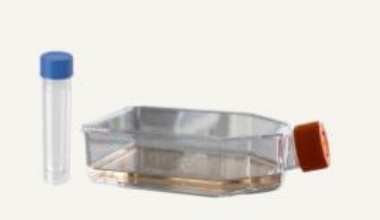
Thaw
Cells are seeded on T-flasks and cultured for 3 days
Vessel inoculation
Cells are harvested from T-flasks and passaged into Lattice mini

Feed
A small feed is added to each Lattice mini vessel
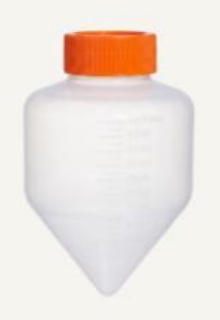
Harvest
Cells are dissociated off carriers in the vessels
The results presented in this application note are compiled from multiple independent experiments. Data shown are representative of each characterisation subset.
05 Results & discussion
hUC-MSCs are capable of rapid attachment to microcarriers in Lattice mini vessels
Figure 2 illustrates the agitation regime applied during the six-hour attachment phase, comprising 2 minutes of rocking with a dynamic cycle rate of ~11.2 cycles/min, followed by a 58-minute static hold. Throughout this phase, vessels are filled to a reduced working volume to increase cell–microcarrier contact probability, as both cells and microcarriers settle into a common bed on the bottom layer of the vessels during static periods. This co-settling promotes attachment by increasing cell–microcarrier collision frequency and by allowing sufficient undisturbed contact time for focal adhesion maturation during the interval in which cells remain most susceptible to shear detachment.
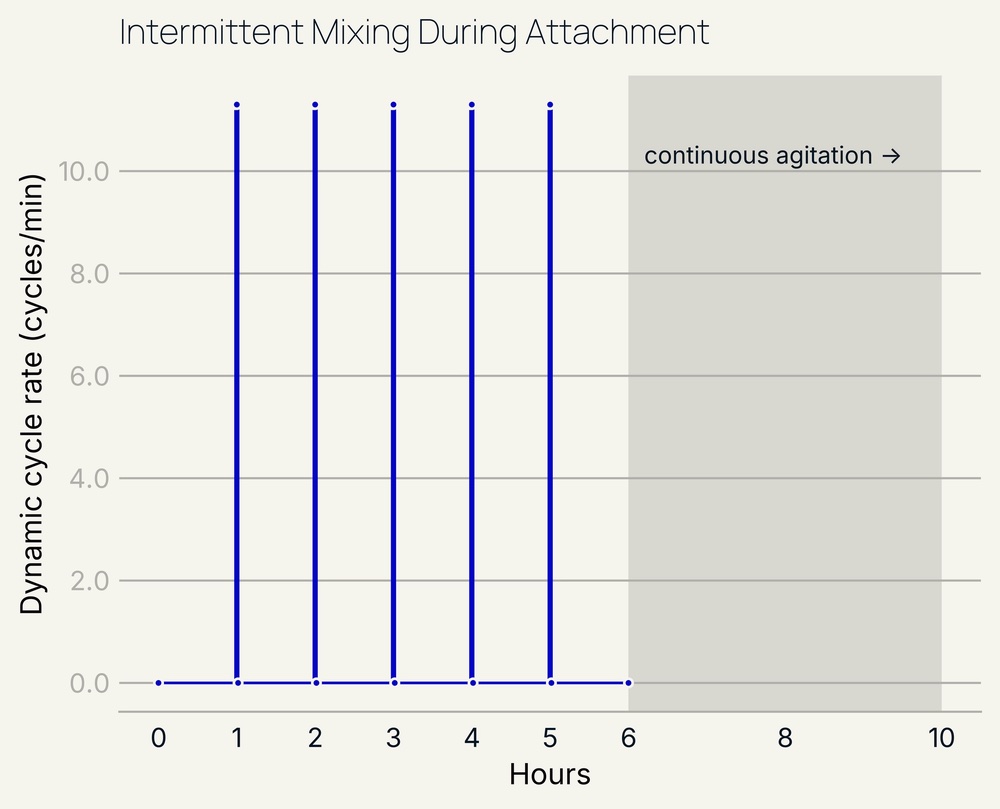
The intervening agitation bursts offset the limitations of prolonged static culture by minimising carrier aggregation and cell clumping, dispersing local gradients in dissolved oxygen, pH and nutrients within the settled bed, and redistributing unattached cells to improve the uniformity of bead occupancy. At the end of the attachment phase, vessels are topped up to full working volume with additional medium and agitation is switched to continuous.
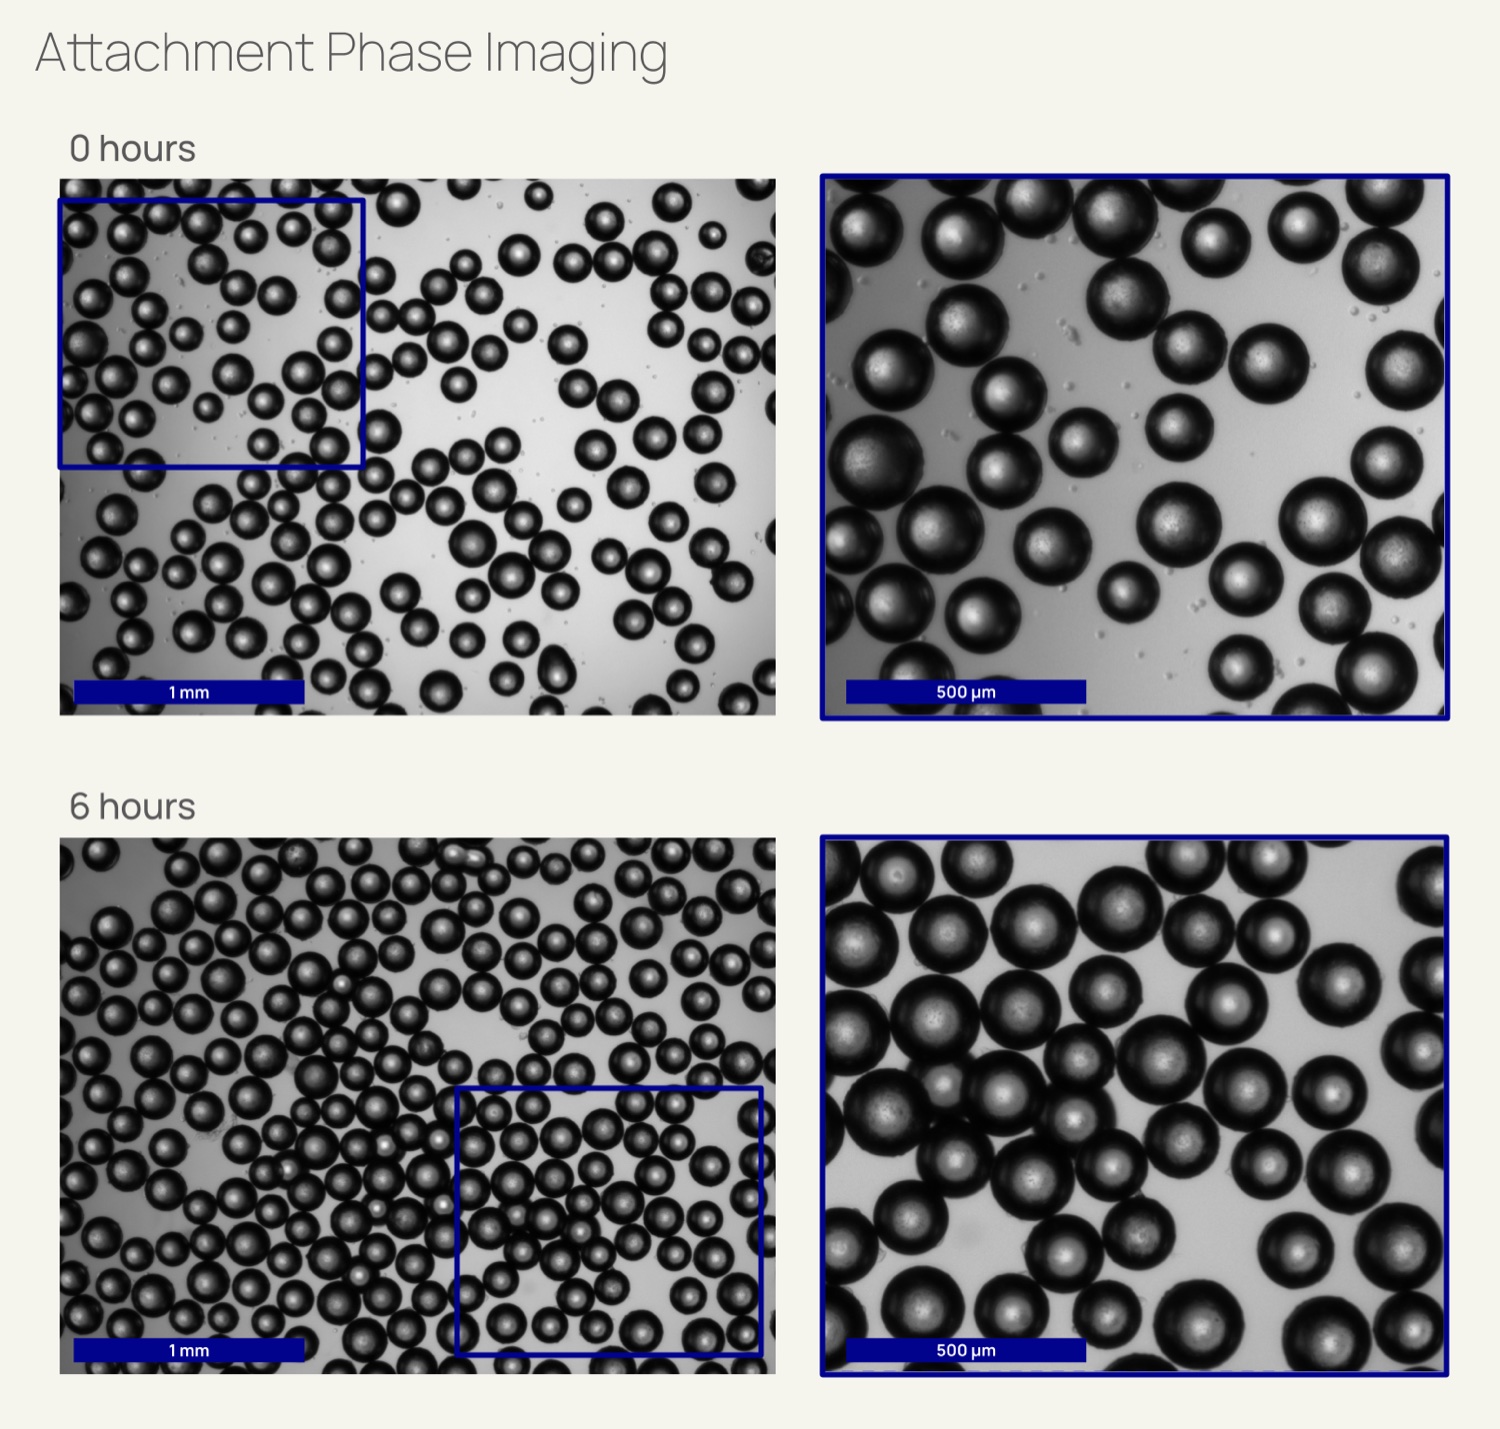
Brightfield imaging captures the progression throughout the six-hour attachment phase, during which cells rapidly and efficiently engage with the microcarriers (Figure 3). At the initial time point, non-attached cells are clearly distributed in the medium surrounding the microcarriers, whilst the microcarrier surfaces themselves remain smooth and well-defined with minimal cell adherence. By six hours, the population of suspended cells in the medium is markedly reduced, with cell attachment and surface spreading already visible across microcarriers.
At the end of the initial attachment period, samples are also stained with calcein AM for live cell imaging (Figure 4). It is important to note that single-focal-plane imaging of 3D spherical microcarriers naturally underrepresents total cell coverage, as cells adhering to top, bottom, or off-axis horizons fall out of focus or are masked by the carrier’s refractive bulk. Nonetheless, live cell staining is a highly effective and efficient method of monitoring cell attachment and proliferation on microcarriers.
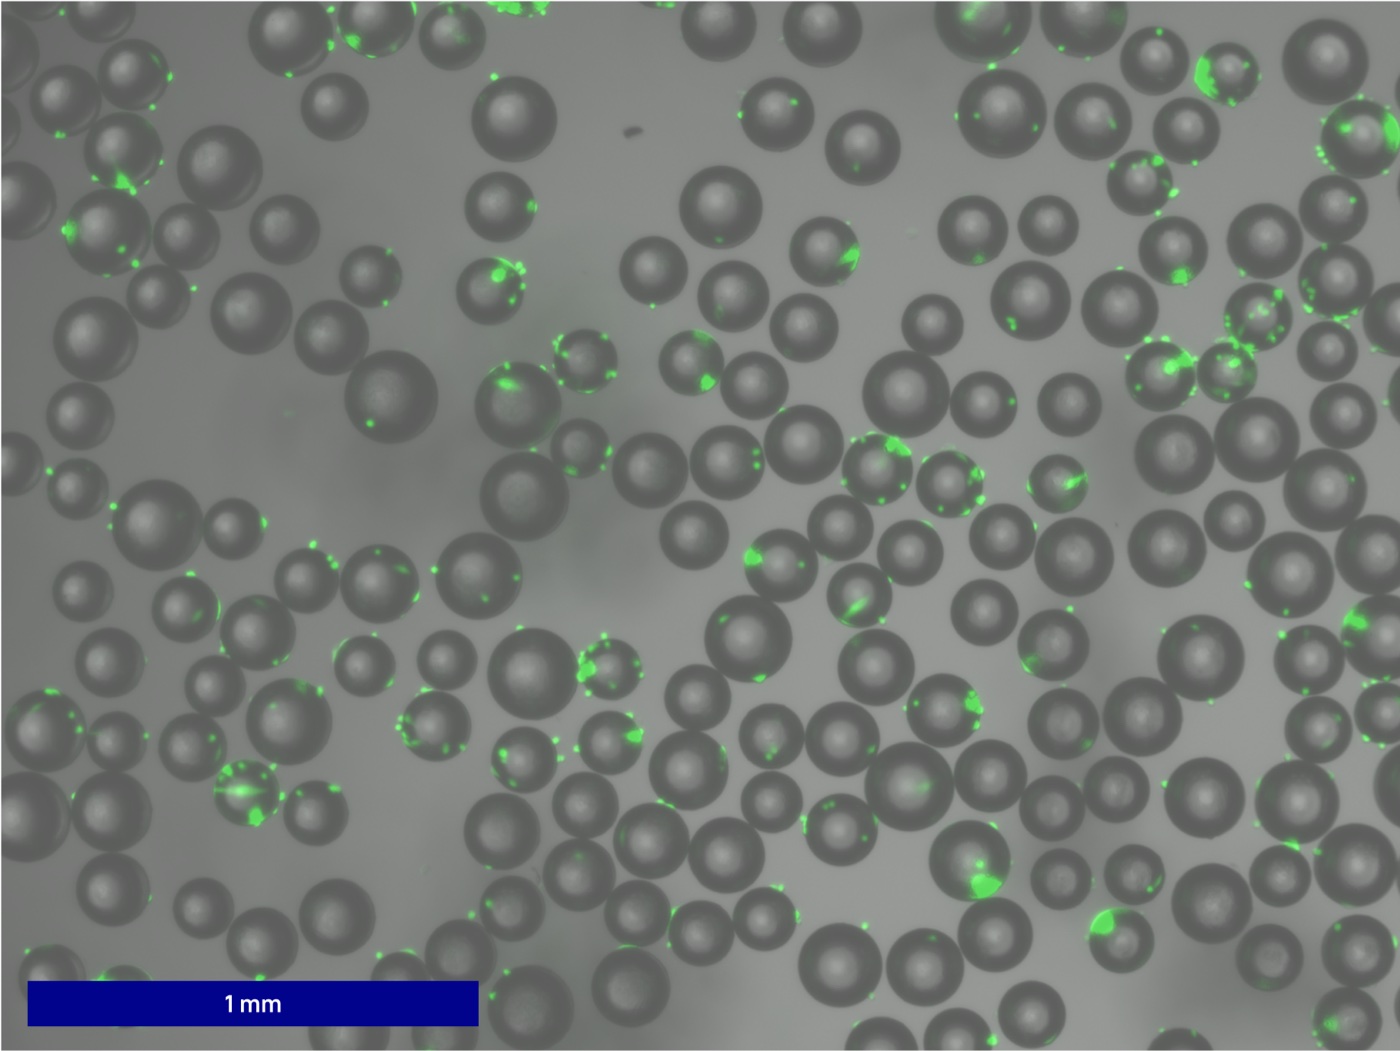
Widespread fluorescence indicates a large majority of microcarriers successfully bonded to viable cells during the attachment phase, particularly when accounting for the focal plane constraints of 2D fluorescence imaging on 3D spherical geometry. Morphologically, a good proportion of cells demonstrate early flattening and spreading across carrier surfaces.
hUC-MSCs expanded on microcarriers in Lattice mini vessels exhibit comparable growth kinetics to 2D controls
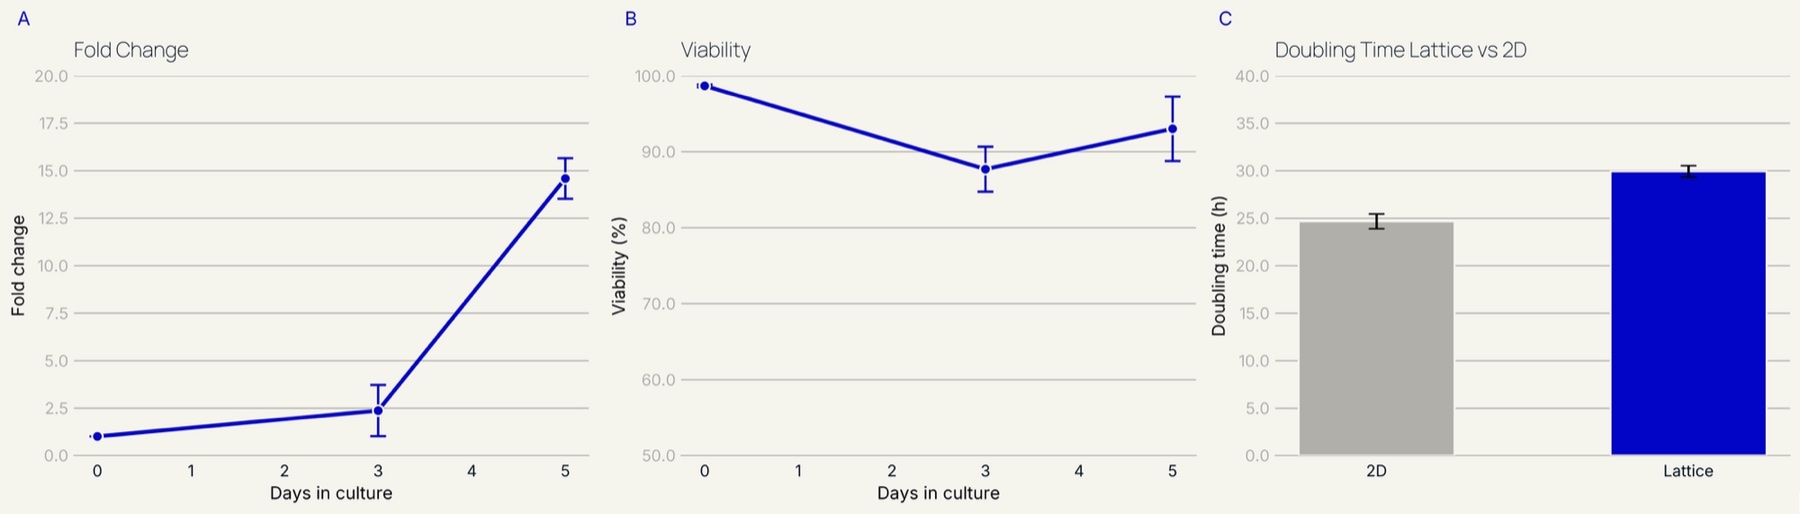
The growth kinetics demonstrate robust and reproducible hUC-MSC expansion on microcarriers within Lattice mini vessels over a five-day culture period, achieving an average fold-change of ~15-fold relative to the initial seeding density. Whilst during the initial attachment and lag phase between days zero–three fold change was modest, the addition of the day three feed resulted in exponential growth.
Healthy cell viabilities were maintained throughout all cultures (average of 93.0% at the end of expansion), and final doubling times in Lattice mini (average of 29.9 hours) were highly comparable to those achieved in 2D cultures at the end of their expansion periods (average of 24.6 hours). These results suggest the system’s suitability as an alternative method for high-density therapeutic cell production.
Live cell imaging and predictions of microcarrier surface coverage allow monitoring of proliferation
Figure 6 showcases the live monitoring of hUC-MSC colonisation of microcarriers over time, being a strong microscopic indicator of culture performance.
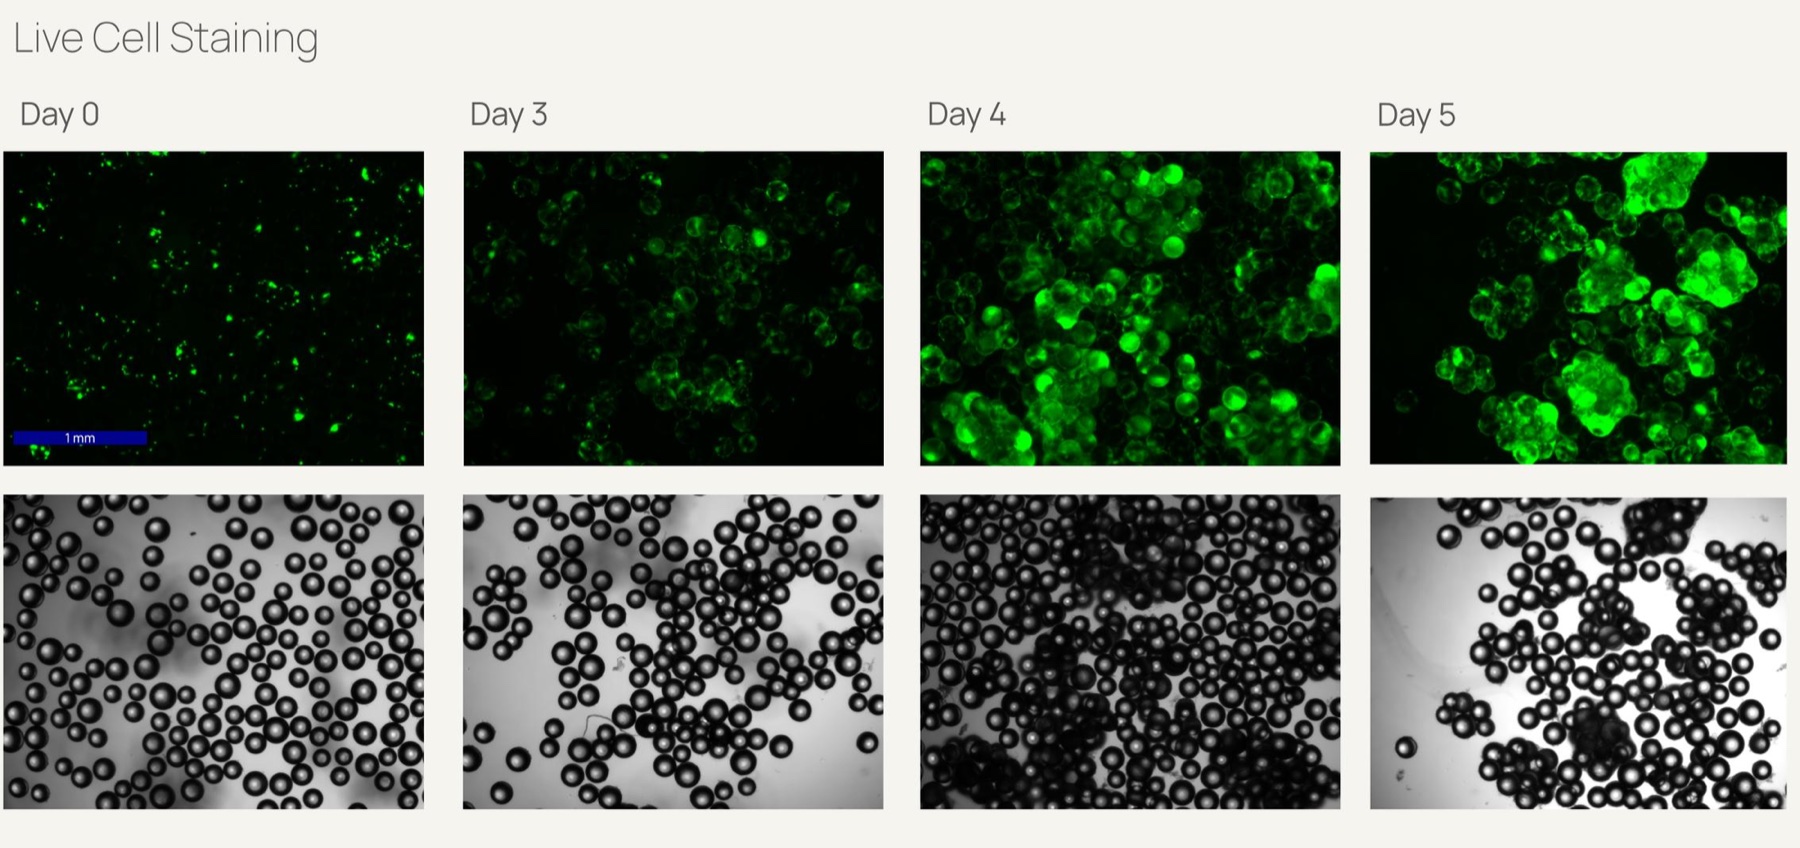
- Day zero: sparse, punctate green fluorescence indicates early cell adhesion onto isolated, evenly dispersed single microcarriers shortly after seeding.
- Day three: increased fluorescence coverage across individual microcarriers confirms successful cell spreading, uniform distribution, and active proliferation.
- Day four: following the day three feed, day four imaging captures cells reaching confluency on individual beads, and bridging adjacent microcarriers, forming early multi-carrier aggregates which are visible in both fluorescence and brightfield views.
- Day five: intensified, continuous green fluorescence across large 3D cell-microcarrier aggregates confirms high cell viability, dense population growth, and optimal confluency for harvest with no visible non-viable areas.
The 2D widefield fluorescence images obtained from three Lattice mini cell batches were analysed by a fluorescence quantification computer vision (CV) model developed by Hoxton Pharma. This analysis output the 2D fluorescent area fraction, which was then used to estimate the 3D surface coverage by inverting a Gaussian-PSF model of axial fluorescence detection, given the bead radius and imaging optics (NA, wavelength, and medium refractive index) — Figure 7.
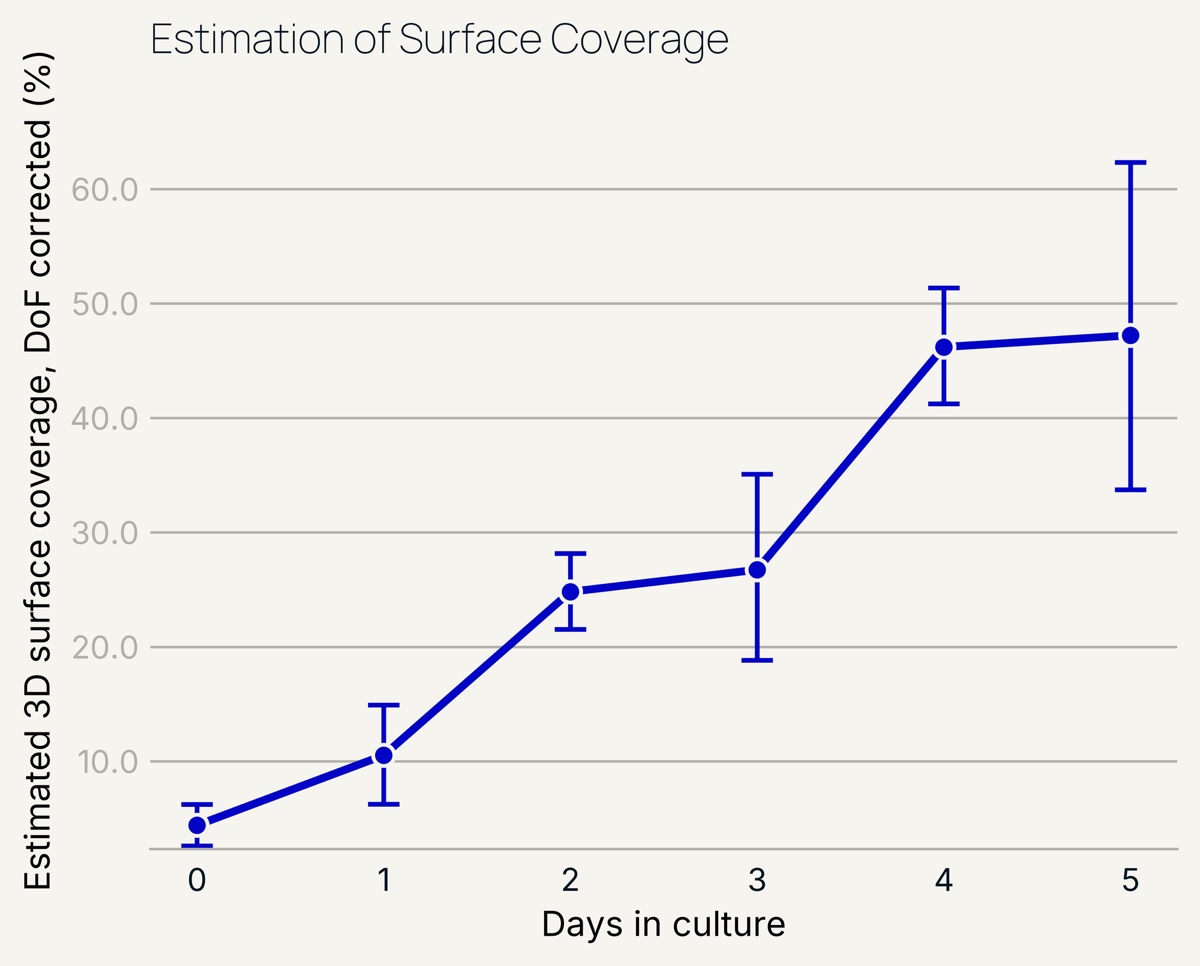
Whilst the cell fold-changes exhibited at day three in Figure 5 reflected a pronounced lag phase with only a modest increase above seeding density (~2.4-fold), 3D surface coverage estimations indicate that moderate proliferation was nonetheless underway relative to post-attachment baselines. Following the day 3 media feed, cell expansion accelerated significantly, driving a steep increase in both fold-change and surface coverage. By day five however, the distributions for estimated surface coverage broadened substantially. This increased variance is likely driven by the microcarrier clumping observed in Figure 6, which creates optical overlap and complicates accurate cell and carrier segmentation in both GFP and brightfield channels.
Maintenance of metabolites and gases at target levels in Lattice mini vessels
Offline metabolite tracking confirmed a healthy, highly active metabolic state throughout the five-day expansion period (Figure 8). During the initial attachment and lag phase between days zero to three, glucose consumption and lactate production remained modest in line with the growth kinetics observed above. Following the day three feed, metabolic activity accelerated sharply, directly correlating with the observed exponential growth.
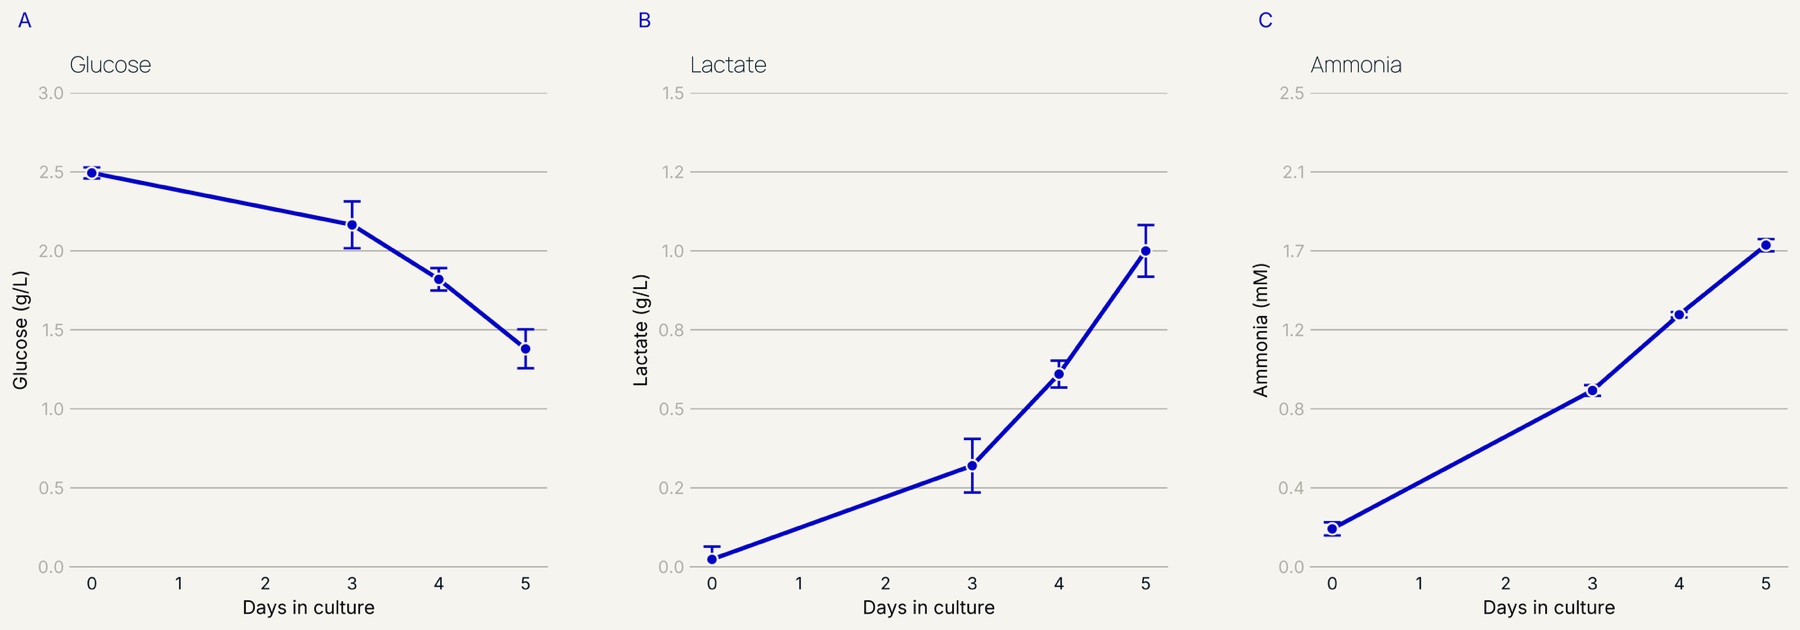
Glucose was consumed at an increased rate post-feed but remained well above limiting thresholds, with an average concentration of 1.38 g/L at the point of harvest on day five. Lactate accumulation mirrored this metabolic shift, rising to an average of 1.00 g/L. Ammonia concentration increased steadily also, reaching an average maximum of 1.7 mM. Both lactate and ammonia remained below reported toxic thresholds for stem cells (Schop et al., 2009), demonstrating that the targeted fed-batch strategy maintains non-inhibitory nutrient and by-product profiles without requiring labour-intensive and costly media additions or exchanges.
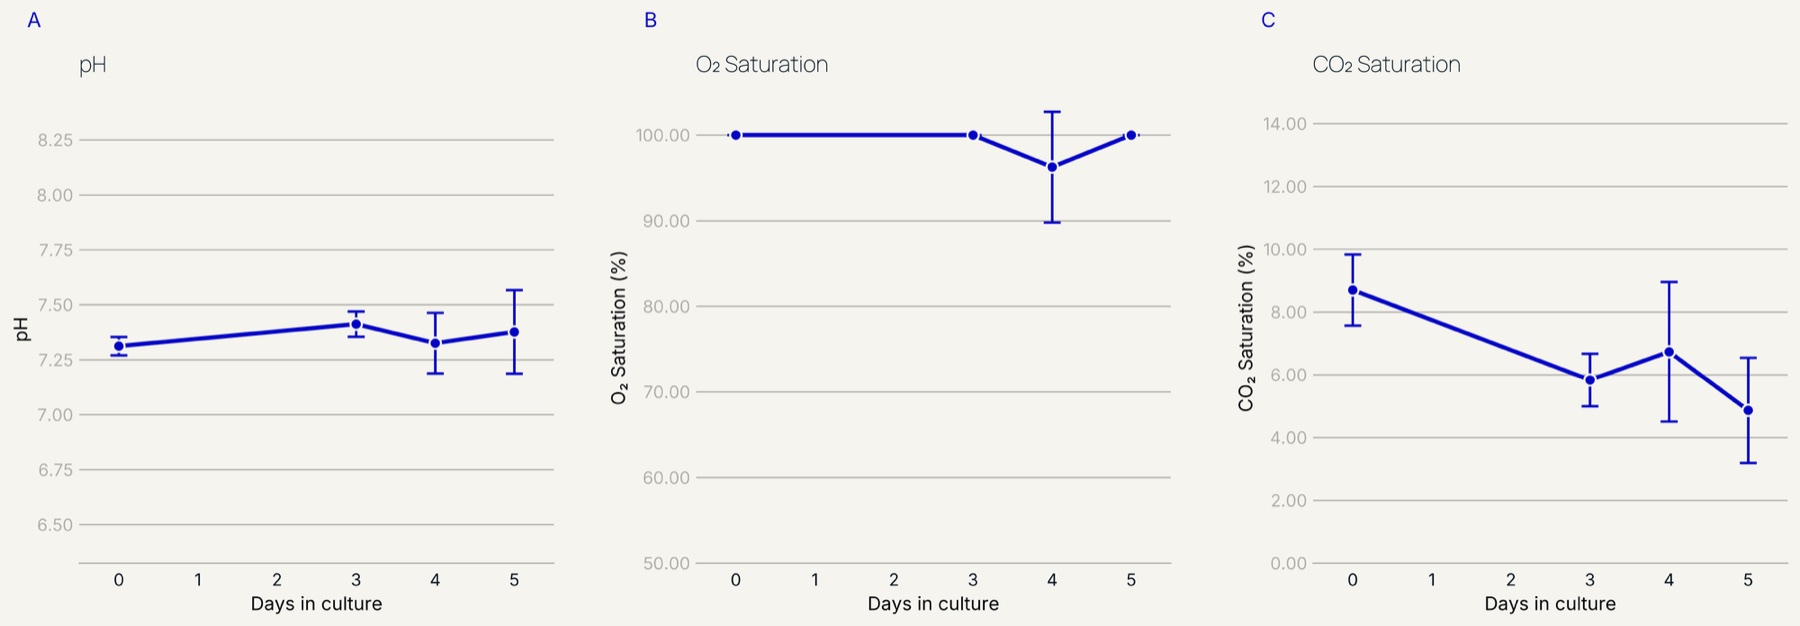
Offline gas and pH monitoring demonstrated high environmental stability across all three batches (Figure 9). pH was maintained within a narrow physiological window via passive CO₂/bicarbonate buffering, even during peak exponential growth. The average pH at the point of harvest was 7.38. Oxygen saturation exhibited a small dip on day four to an average of 96.3%, following accelerated growth from the day three feed. By day five however, oxygen saturation increased again, validating the ability of the gas-permeable film to deliver adequate oxygenation. Dissolved CO₂ saturation initially decreased as it equilibrated from fresh media levels down to baseline incubator conditions of 4.5–5%. On day four, a slight elevation to an average of 6.7% was observed due to increased metabolic activity, before dropping again by day five, confirming effective gas removal through the film.
MSC marker expression is retained after 3D microcarrier expansion
| Target | Fluorochrome | Product code (Miltenyi) |
|---|---|---|
| CD14 (negative) | FITC | 130-110-518 |
| CD14 (control) | FITC | 130-113-437 |
| CD34 (negative) | PE | 130-120-515 |
| CD45 (negative) | FITC | 130-110-631 |
| CD19 (negative) | FITC | 130-114-171 |
| CD19 (control) | PE | 130-113-438 |
| CD73 (positive) | PE-Vio770 | 130-112-062 |
| CD73 (control) | PE-Vio770 | 130-113-440 |
| CD105 (positive) | APC | 130-112-324 |
| CD105 (control) | APC | 130-113-434 |
Flow cytometry analysis of hUC-MSCs is shown in Figure 10 and revealed lineage purity across both the standard 2D control and the 3D Lattice conditions. Expression of all negative haematopoietic and endothelial markers (CD14, CD19, CD34, and CD45) remained negligible, reading at approximately 0.0% to 1.0% for both culture formats. Both conditions successfully maintained negative marker profiles well below the 2% International Society for Cell & Gene Therapy (ISCT) maximum threshold, confirming the absence of spontaneous differentiation.
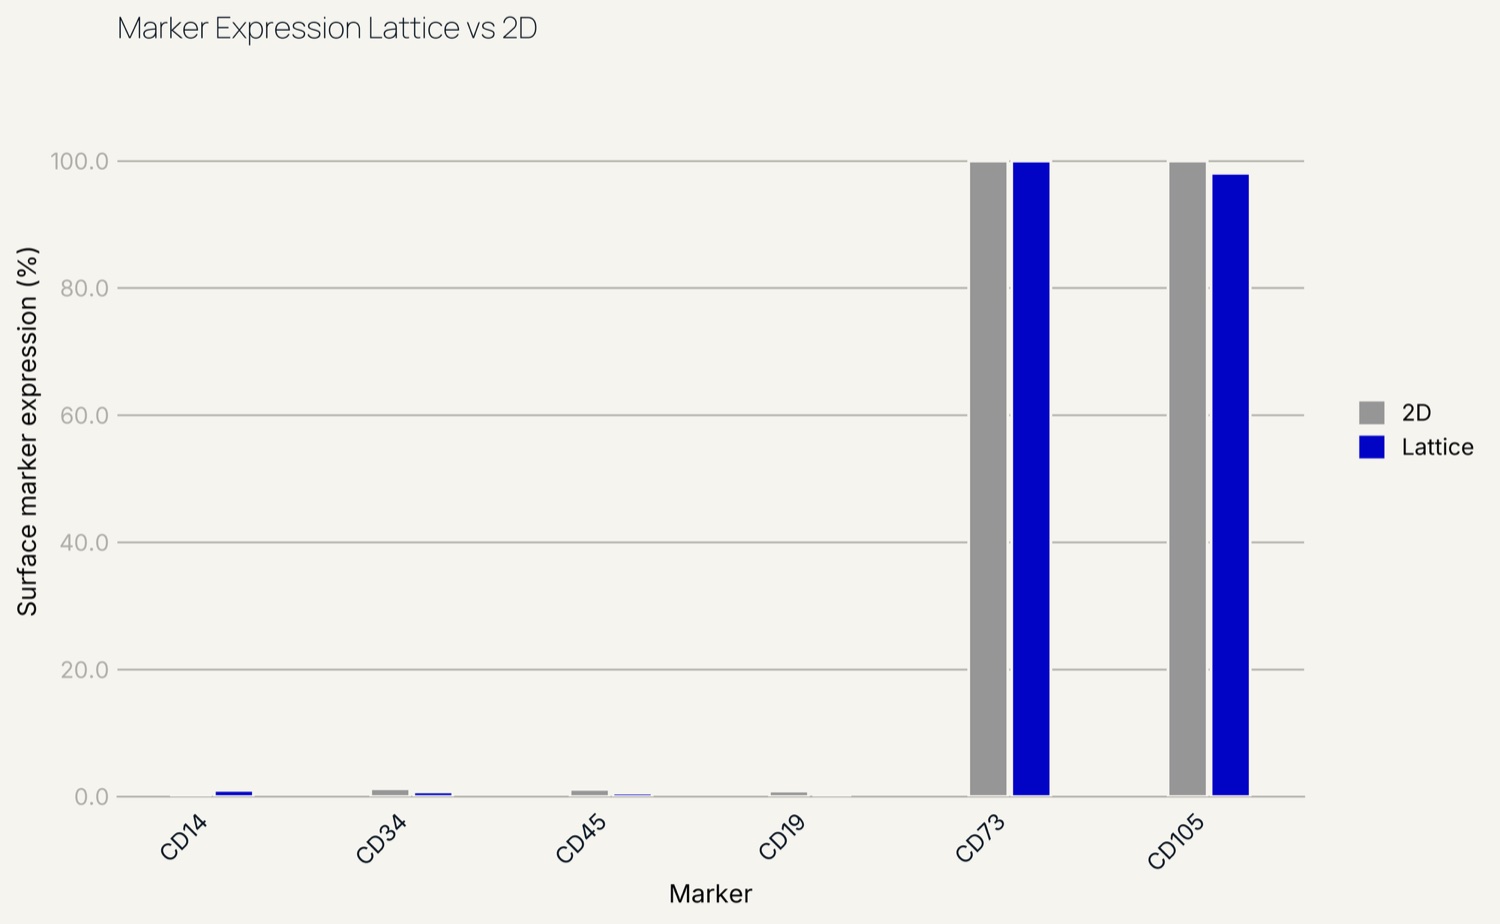
Analysis of positive surface markers demonstrated a shared phenotypic profile between the two conditions. CD73 expression was highly conserved, with the Lattice culture successfully exceeding the 95% ISCT minimum (reading near 99%). CD105, typically also mechanosensitive and confluence-dependent, displayed parallel expression in both formats. Levels read at 80% and 78% for 2D and 3D respectively. Notably, the 3D Lattice culture closely mirrored the baseline 2D control, demonstrating no significant scaffold-induced phenotypic divergence.
The primary objective of this assessment was to evaluate the capacity of the 3D Lattice system to support hUC-MSC expansion whilst maintaining classical stromal phenotypes. The data confirms that the Lattice system is highly biocompatible, actively preventing spontaneous differentiation and maintaining absolute lineage purity (as evidenced by the lack of CD14, CD19, CD34, and CD45 expression). Furthermore, the Lattice system demonstrated retention of CD73, underscoring its ability to support core metabolic cell viability during 3D expansion.
Whilst CD105 expression fell below the 95% ISCT target, the parallel decline in both the Lattice and 2D control conditions is highly revealing. This shared suppression indicates a systemic, pre-existing environmental variable rather than a platform-induced artefact: CD105 (Endoglin) is notoriously sensitive to contact inhibition, hence any dense pre-culture conditions reliably trigger the down-regulation of these receptors as the cells temporarily arrest. Crucially, harvesting cells from a 3D microcarrier environment requires a more rigorous enzymatic dissociation process than standard 2D flasks. Proteolytic enzymes readily cleave delicate surface glycoproteins like CD105. The fact that the Lattice-expanded cells endured the compounding stress of a 3D enzymatic harvest, yet still maintained a phenotypic profile nearly identical to the 2D control, suggests that the Lattice system is an adequate bioreactor platform for the expansion of MSCs with desirable phenotype.
Scalability: modelling a path to 1 billion cells
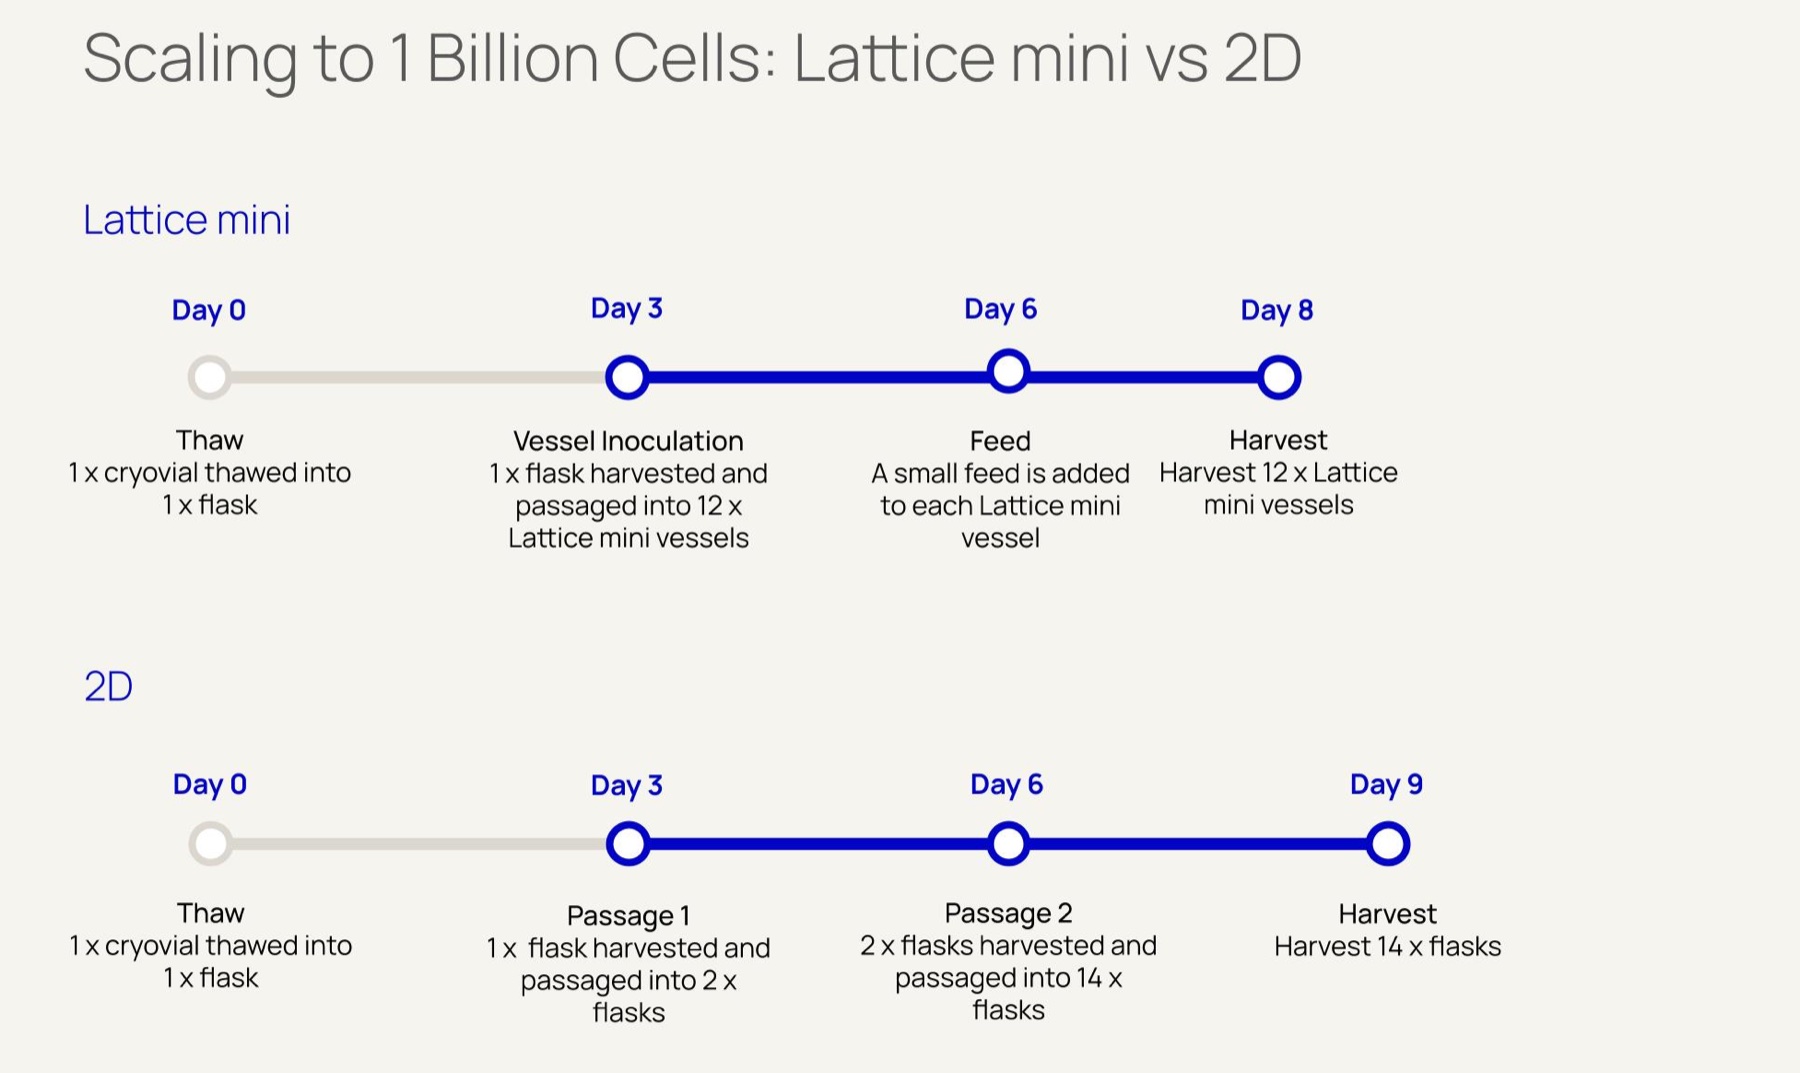
To evaluate the commercial viability of the Lattice mini system for therapeutic manufacturing, the average doubling times demonstrated in Lattice mini and 2D controls were used to model processes for scaling to a target yield of 1 billion hUC-MSCs.
- Flasks refer to 5-stack culture chambers with 3,180 cm² cell growth area and 750 mL working volume.
- 2D flasks are seeded at a density of 3,000 cells/cm² and undergo a three-day expansion period.
- Lattice mini vessels are seeded at a density of 0.23e5 cells/mL with a fixed working volume of 250 mL, a carrier density of 14 g/L of carriers, and undergo a five-day expansion period.
- Costs used: $1050/L for 2D media, $1520/L for 3D media, and £490/100 g for microcarriers. Only media and carrier costs were modelled; no other consumable or operational costs have been included.
| Process | # Flasks | # Lattice mini vessels | # Lattice mini units | Media volume (L) | Final yield (M cells) | Cost per million cells |
|---|---|---|---|---|---|---|
| Lattice mini | 1 | 12 | 2 | 3.75 | 1,115 | $5.05 |
| 2D | 17 | – | – | 12.75 | 1,020 | $13.17 |
Despite the increased costs of the 3D feed medium and microcarriers, the expansion process in Lattice mini provides significant economic and operational savings relative to traditional 2D systems by reducing the overall media consumption, the number of vessels that require handling, and the total process duration.
Following a thaw into a 5-stack culture chamber, hUC-MSCs can be expanded in Lattice mini to a total yield of 1 billion cells consuming 70% less media than a 2D process which continues in the 5-stack chambers. Only two Lattice mini units are required, each containing six vessels with 250 mL working volumes cultured over five days. The 2D process requires two additional passages over a six-day period, using a total of 16 additional 5-stack culture chambers. The total savings in media costs (including carrier costs) are 62%, given the higher surface area to media volume ratio in Lattice mini vessels vs 2D (~5 cm²/mL vs ~4.2 cm²/mL) and the ability to seed at a higher density (23.0 × 10³ cells/mL vs 12.7 × 10³ cells/mL; ~4.6 × 10³ cells/cm² vs 3.0 × 10³ cells/cm²) without reaching over-confluency or experiencing depletion of nutrients and toxic accumulation of waste products.
06 Conclusion
For hMSC therapies to become widely available, cost-effective and scalable manufacturing methods are required. This study has demonstrated that using the Lattice mini platform allows for reproducible and successful expansion of these cells on microcarriers to therapeutically relevant yields whilst reducing media costs by 62% when compared to traditional 2D culture methods. Furthermore, controlled rocking motion and passive gas transfer maintain continuous microcarrier suspension, optimal dissolved oxygen, and stable physiological pH without the cell damage caused by impeller shear, direct sparging, or acid/base additions. The expanded cells also maintained desirable phenotypic traits, as demonstrated by the stem cell panel tested with flow cytometry.
The modular set-up of Lattice mini provides an effective pathway to commercial capacity without the need to re-characterise and re-optimise the expansion process as is often required when scaling up traditional bioreactors. With the ability to scale out for high-yield allogeneic production or provide physical isolation for autologous patient lots, Lattice mini offers a robust, practical, and economical manufacturing strategy to accelerate the commercial delivery of MSC-based therapeutics.
07 References
- Hewitt, Christopher J., et al. “Expansion of Human Mesenchymal Stem Cells on Microcarriers.” Biotechnology Letters, vol. 33, no. 11, 2011, pp. 2325–35. doi:10.1007/s10529-011-0695-4
- Lembong, Josephine, et al. “Bioreactor Parameters for Microcarrier-Based Human MSC Expansion under Xeno-Free Conditions in a Vertical-Wheel System.” Bioengineering, vol. 7, no. 3, 2020, p. 73. doi:10.3390/bioengineering7030073
- RoosterBio, Inc. “Recommended Protocol for Fed-Batch hMSC Expansion in Spinner Flasks.” RoosterBio, Apr. 2023.
- Schop, Deborah, et al. “Growth, Metabolism, and Growth Inhibitors of Mesenchymal Stem Cells.” Tissue Engineering Part A, vol. 15, no. 8, 2009, pp. 1877–86. doi:10.1089/ten.tea.2008.0345
- Wagner, Wolfgang, et al. “Replicative Senescence of Mesenchymal Stem Cells: A Continuous and Organized Process.” PLOS ONE, vol. 3, no. 5, 2008, p. e2213. doi:10.1371/journal.pone.0002213
- Zeiser, Robert, et al. “Novel Therapies for Graft versus Host Disease with a Focus on Cell Therapies.” Frontiers in Immunology, vol. 14, 2023, p. 1241068. doi:10.3389/fimmu.2023.1241068
A formatted PDF of this note is being finalised and will be available here shortly.
Download PDF Coming soon